
Napakahalaga ng Charts pagdating sa Technical Analysis dahil nakasalalay ang analysis ng stock ayon sa nakaraang paggalaw nito na maipapakita ng malinaw ng mga charts.
Ano ang composition ng isang Chart?
Ang chart ay binubuo ng mga x and y axis. Ang axis ang kumakatawan sa parte ng isang chart. Ang x axis o ang pahalang na linya (horizontal line) ang kumakatawan sa panahon o time, samantalang ang y axis o ang patayong linya (vertical line) naman ang kumakatawan sa presyo o price.
Sa economics, madalas din ginagamit ang chart sa pagpapaliwanag ng supply and demand. Ang x axis ay kumakatawan sa quantity o dami samantalang ang y axis naman ay kumakatawan rin sa presyo o price.
Ano ang iba’t ibang uri ng price fields?
Pagdating naman sa presyo, may iba’t ibang kategorya ito. Ang mga sumusunod ang mga uri nito:
1. Open – Ito ang tawag sa unang presyo na traded ang stock para sa period na iyon.
2. High – Ito naman ang tawag sa pinakamataas na presyo na traded ang stock sa loob ng isang period. Ito ang puntong mas marami ang sellers kung ihahambing sa mga buyers.
3. Low – Ito ang tawag sa pinakamababang presyo na traded ang stock sa loob ng isang period. Ito ang puntong mas marami naman ang buyers kung ihahambing sa mga sellers.
4. Close – Ito ang tawag sa pinakahuling presyo na traded ang stock para sa isang period. Ito ang pinakagamit na presyo para sa analysis na Technical.
Ang relasyon ng Open and Close na mga presyo ang itinuturing na pinakamahalagang impormasyon ng mga Technicians.
5. Volume – Ito ang kumakatawan sa bilang ng mga shares na traded o nagpapalit-palit sa isang period.
6. Bid – Ito ang terminolohiyang ginagamit sa presyo na ang buyer ay willing bayaran o bilhin ang isang stock.
7. Ask – Ito ang tawag naman sa presyo na ang seller ay willing tanggapin.
Ano ang iba’t ibang uri ng mga Charts?
May iba’t ibang klase ng charts na ginagamit ng mga Technicians. Ang ilan sa mga klase nito ay ang Line Chart, Pole Charts, Bar Charts, Point & Figure Charts, at Candlestick Charts.
Sa puntong ito, aking ipapaliwanag ang pinaka ginagamit na uri ng mga charts ng mga Technicians.
Bar Chart
Makikita sa ibaba ang itsura ng isang bar chart:
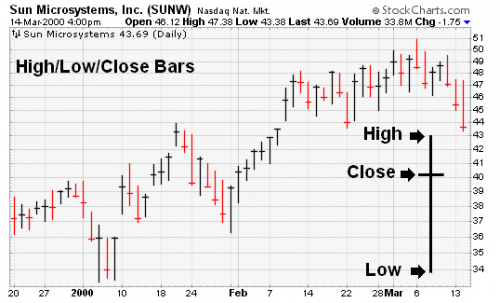
Gaya ng nasa larawan sa itaas, ipinapakita nito ang high, low, at closing price ng stock. Makikita rito na itim ang kulay na ginagamit kapag ang stock ay nagsara ng mas mataas kaysa sa nakalipas na araw samantalang pula naman ang gamit kapag ito’y nagsara ng mas mababa kaysa sa nakalipas na araw.
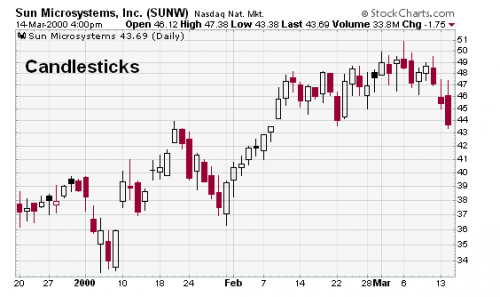
Candlestick Chart
Makikita naman sa ibaba ang itsura ng isang candlestick chart. Ang paggamit nito ay nagsimula sa bansang Japan na pinaniniwalaang mahigit 3000 taon na ang nakakaraan.
Madalas na ginagamit ang candlestick ng mga technicians dahil madaling makita rito ang relasyon ng opening and closing prices ng mga stocks na madalas gamitin pagdating sa technical analysis.
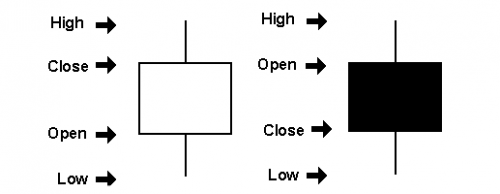
Makikita sa ibaba na binubuo ito ng High, Low, Open, ang Close. Itim ang kadalasang ginagamit na kulay o pula kapag ang stock ay sumara ng mas mababa kaysa sa nakaraang araw na presyo. Samantalang ang kulay naman ay puti o berde kung nagsara naman ito ng mas mataas kaysa sa nagdaang araw.
Ang konsepto ng Support at Resistance
May iba’t ibang bagay na ikinokonsidera pagdating sa trending. Ito ay ang mga sumusunod:
1. Support – ito ang tawag sa price level na kung saan ang demand ay napakalakas na humahadlang sa patuloy na pagbaba pa ng presyo.
2. Resistance – ito naman ang kabaliktaran ng support. Ito ang tawag sa price level na kung saan ang pagbebenta ay lubhang napakalakas na humahadlang sa patuloy na pagtaas pa ng presyo.
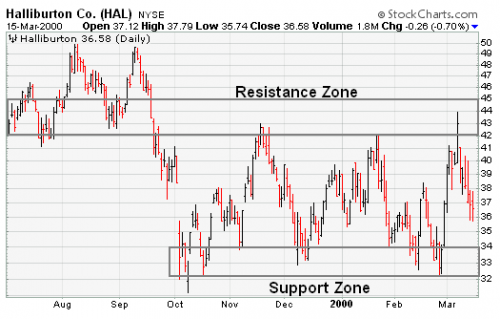
Kapag ang support ay naputol, ito ay nagiging bagong resistance. Sa kabilang banda, kapag ang resistance ay naputol, ito naman ay nagiging bagong support.
Sa pag-eestablish ng isang trend, mahalaga na maraming test ang ginagawa dahil kung ito’y maraming beses nang napatunayan, mas lalong tumitibay ang trending. Tinitignan din ang konsepto ng Trend Acceleration o Deceleration pagdating sa trends kung ito ba ay weak, healthy, o overheated.
Technical analysis is a method of examining past market data to help forecast future price movements. Using different tools, indicators, and charts, traders can spot important price patterns and market trends, and then use that data to anticipate a market's future performance.
While fundamental analysis involves analysing the characteristics of a company in order to estimate its value, technical analysis uses a different approach. It doesn't consider the "value" of a company or a commodity at all. In contrast, technicians (or chartists) are just interested in the price movements in the market.
Technical analysis is based around a market's price history, rather than the fundamental data such as earnings, dividends, news, and events. The belief is that price action tends to repeat itself and the patterns can be identified and used to define a market's trend.
Despite all the fancy and exotic tools it uses, technical analysis actually only looks at supply and demand in a market in an attempt to determine what direction, or trend, will continue in the future. In short, technical analysis attempts to understand the emotions in the market by studying the market itself, as opposed to its components. If you understand the benefits and limitations of technical analysis, it can give you a new set of tools or skills that will enable you to be a better trader or investor.
In analyzing a chart of trading prices, indicators measure changes in market sentiment — bullish, bearish, etc. Indicators are just patterns on a chart or arithmetic calculations whose value depends on how you use them.
Moving averages are lagging indicators help gauge the direction of the current trend of a market. Trend Lines are important for identifying and confirming trend direction. The Relative Strength Index (RSI) is a momentum oscillator that measures the strength and speed of a market's price movement by comparing current price to past performance. Fibonacci retracements can help traders identify significant price points and predict levels of support and resistance.
But these are not perfect, and not 100 percent effective. Many times, your indicator will fail and you’ll take losses in technical trading. However, don’t take it personally. Comfort yourself knowing that using indicators minimizes losses, but indicators never eliminate all losses.
Sa mga susunod kong articles, ipapaliwanag ko naman ang tungkol sa konsepto ng Bullish at Bearish market and iba’t ibang klase ng mga chart patterns nito.